Loadruuner Helpline by Bhupendra Varshney, Loadrunner Help online, Loadrunner issues

Welcome To Loadrunner Helpline By Bhupendra Varshney

Monday, September 17, 2012

Loadrunner Analysis Graphs

1) Summary page shows the summarized analysis on single page.


2) Running Vusers displays the number of Vusers that executed Vuser scripts, and their status, during each second of a load test. This graph is useful for determining the Vuser load on your server at any given moment.


 3)  Hits per Second displays the number of hits made on the Web server by Vusers during each second of the load test. This graph helps you evaluate the amount of load Vusers generate, in terms of the number of hits.


 4)      Throughput displays the amount of throughput (in bytes) on the Web server during the load test. Throughput represents the amount of data that the Vusers received from the server at any given second. This graph helps you to evaluate the amount of load Vusers generate, in terms of server throughput.


 5)      Transaction Summary displays the number of transactions that passed, failed, stopped, or ended with errors.


6)      Average Transaction Response Time displays the average time taken to perform transactions during each second of the load test. This graph helps you determine whether the performance of the server is within acceptable minimum and maximum transaction performance time ranges defined for your system.


7)      Connections per Second display the number of Connections per Second.


8)      Transaction Response Time Under Load displays average transaction response times relative to the number of Vusers running at any given point during the load test. This graph helps you view the general impact of Vuser load on performance time and is most useful when analyzing a load test which is run with a gradual load.


9)      Transaction Response Time (Percentile) displays the percentage of transactions that were performed within a given time range. This graph helps you determine the percentage of transactions that meet the performance criteria defined for your system.


Performance Testing Process

Performance Testing Process

The performance testing of any application can be carried out based on the NFRs (Non-Functional Requirements). This is normally done with a discussion/meeting with the client/Business Analysts during the project planning phase. Generally this is given in terms of SLA - page response time or transaction response time, Hits Per Second, Throughput etc.


Planning a Performance Test

The following needs to be answered by a client/BA during planning of performance test –

1) Business Processes to be tested

2) Anticipated user load of application

3) Division of user load among business process (based on current logs)

4) Architecture of application

5) Environment for performance testing


For example –In mentioned point 1, three business processes need to be recorded for performance testing – Business Process 1, Business Process 2 and Business Process 3, in point 2, the evaluated application load is 200 virtual users and percentage of each business process is 40%, 30% and 20% respectively- i.e. the actual virtual user load for these business processes will be 80, 60 and 40 respectively.


Designing Performance Test Scenarios

Once the planning of performance testing is completed, performance testing team designs the test cases based on the business process provided by client/BA. These will include the step by step functionality with expected result, and the data requirement for each page. This will help the performance tester to automate the script and will help in anticipating the master/external data requirement for automated script.


Scripting Performance Test Scenarios

After completion of test case designing the performance tester will record the business processes using testing tool (Loadrunner) followed by script enhancements. These scripts will be reviewed by a technical lead/performance architect.


Test Data Generation

The testing/dev team will generate the data for test execution.


Test Scenario Design using Loadrunner Controller

Performance tester will design the scenario/mix for scheduling the groups and configuring monitors. For configuring Solaris counters the testing team can use two approaches –

1) UNIX monitor configuration using rstatd daemon utility (Please refer to Solaris counters )

2) Windows monitor configuration using perfmon (Please refer to Windows Counters)


Test Execution and Monitoring using Loadrunner Controller

After designing all test scenarios the tester will execute the test run and will be monitoring the graphs e.g – Server resource graphs, Running Vusers, Hits per Second, Throughput, Transaction Response Time, Connections per Second etc. Also the server logs can be monitored during test execution.


Test Result analysis using Loadrunner Analyzer

The result will be collated after test execution and using LR interactive graphs, the report can be published in HTML and/or Excel and/or Word document. This report will contain the summary of test and graphs as per the requirement. (Please refer to Analyzer Graphs section)

Monday, May 2, 2011

VU Gen (Virtual User generator) Cond...

FAQs

In order to record a script in VU Gen one may ask few questions about scripting. I am mentioning below some of most frequently asked questions in VU Gen script recording -

Question 1) What is a VUGen script?
 Answer   :   A VUGen script is end-to-end functionality (business flow) of an application, recorded by Loadrunner's component VUGen. Some people call it a "session" in other tools.
Question 2) Which language is used in script recording in LR?
Answer   : VUGen script is recorded in C Language.

Question 3) What is a length of a script?
Answer : Tength of a VUGen script varies from application-to-application, and business process length.

Question 4) What is the extension of a VUGen script file?
Answer : .usr ("dot usr")

Question 5) What is important in VU Gen scripting?
Answer : The flow that you are recording in VUGen is important. Because in some cases it has been observed that the client refuses to accept the result of a performance test stating- this is not what we expected to test. So planning of business process scenarios (flows or functionalities) is the key element of VUGen script recording.

Question 6) What is the cost of VUGen?
Answer:  It's Free. As the VU Gen is a component of Loadrunner that comes with the evaluation version and that too free. The license key is required for the use of Load controller. However, Load controller comes with an evaluation version for 10 days.

Question 7) Is VUGen scripting simple or difficult.
Answer: It is not simple until you initiate it and it is not difficult if you do it.

Question 8) What is correlation in Loadrunner and why correlation is important?
Answer: Correlation is used to capture dynamic values returned from the server. Every iteration requires
              some unique dynamic values that can only be captured using correlation.

Question 9) What are run-time settings in VUGen?
Answer : Run-time settings are configuration settings that to be done before running a script but for during
               run. These settings are simulation settings for a script. For example - You can simulate the
              browsers that are not available on your client machine. You can simulate number of itereations,
              network bandwidth etc.

Question 10) While running the VUGen script, I am not able to see the browser. How can I see that, and what term is used to call that browser?
Answer : The browser that can be watched during every step of your script, is called as "run-time 
                browser". By default it is disabled after fresh installation of VUGen.
               To enable it go to - Tools -- > General Options-- > Display Tab -- >
               Check "Browser during display"--  > Click OK button
               See the below image for quick glimpse.


Tuesday, April 26, 2011

VU Gen (Virtual User generator)

Hello Friends,

The wait is over now. After a long span of 1 year, upon many of my follower's request through mail, I am back with new ideas on treasures of Loadrunner. Before start explaining the concept of VU Gen, I would request you to please read out my previous two blogs on Web Performance Testing and Components of Loadrunner.... Uhhhh....typing up whole Loadrunner is too lengthy..is'nt it?? So we will refer LR to Loadrunner... :-)....

VUGen is a component of LR used to perform the recording a script. A script is nothing but an end-to-end functionality of a business process. But the question is how to find out the optimum script flow for an application and who provides that, are the key questions one may raise. I will cover this in Performance Test Planning. For now I will put more light on the script flow.

Let's take an example of a third party transfer functionality of net-banking application (of course web application in our context) to more understand the end-to-end functionality. In a net-banking application, the user will first type in the URL in the address bar of Web browser. After page appears he will login to the application and will be able to see his main page. Next he will go to Fund Transfer (term may vary for different websites) and then he will select third party transfer (with-in bank) and  then he will select 1) "from account" from dropdown (source account from which the fund has to be transfer), 2) To account (destination account beneficiary) and then he will enter the amount in the Text box and then click Pay button. He will get the success message from the server for the transaction. (some must be thinking what if the transaction fails, then the answer is - we always record the script with functionally valid build and valid data). After that the user will Logout.


Actions

So on nutshell, the script's steps (flow) will be as follows -


Home Page-->Login button--> Fund Transfer--> Third party transfer Link -->Submit Details Button --> Logout

Here the above six flows are called as six actions of third party transfer script. After we are done with the identification of the business flows we will start recording the script.

Parameterization:

The above steps of a script are captured in separate section (as a function) in the VUGen. After we record the script, we select for the static values (the values which a user has to enter manually). These static values will then be parameterized in order to simulate  the multi-user load (for example for 100 user test we have to parameterize User ID and Password field and save the parameter file (dat file) with 100 different User IDs and Password.

After we are done with parameteization we will start correlation.

Correlation

Correlation is the core of the scripting. When we record the script, some dynamic values (generated by the server dynamically) are recorded and hard-coded in the script which need to be correlated so  that it gets changed for every iteration. The example of such dynamic values are -Session ID, UID, SID, JSession ID..the IDs which are unique for a single iteration and gets expired with the session of a user.

One function fulfills this need of correlation -

web_reg_save_param("Parameter Name",
"LB=Left Boundary",
"RB= Right Boundary"
"ORD=Ordinal on which the value falls",LAST);


Content Check


After correlating the dynamic values, we check for the success of our page. We find out some string (text) on the page which appear on the success of an action. For example, when we logout from the appilcation, an appilcation gives a message - "You have been successfully logged out".
 
We will set this value to be a symbol of pass criteria of our transaction (will explain you later).
 
This content check will be  used for error handling of our script.
 
One function is used for this -
 
web_reg_find("Text=Text To Be find");
 
Think Time


Think time is the time a user takes to think while performing some action (enter detail, clicking a button etc);

We use the following function for applying  the think time between two transactions.

 lr_think_time("number");

To be continued.....


Thursday, April 15, 2010

VuGen-Installation : How to install only VU Gen

Today, I am going to start off with the installation of VUGenerator (VUGen) of evaluation version of Loadrunner 9.0.

Firstly check your systems configuration and minimum resource requirement as below-

1) Processor              -  Not less than PIII (1 GHz) And recommended is PIV (2.4 GHz)
2) Operating Systems -  Windows 2000 (SP 4) or more; Unix- Solaris 9 (2.9) and 10 (2.10), HP-UX 11i V2, IBM AIX 5.2 and 5.3, RedHat Linux Advanced Server 3.0
3) RAM                    -  1 GB
4) HDD                     - 2 GB

 Tip: For seamless installation close the antivirus (specially McAfee or Aladdin's eSafe anti-virus) if installed on your machine.

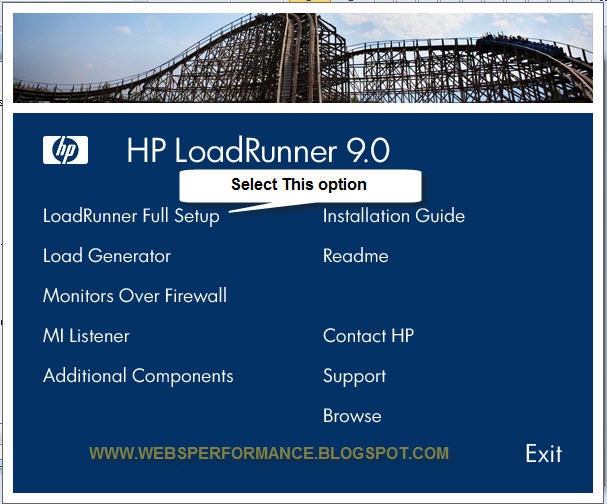
After having the verification of the above required specifications, run the installer exe and you will see the below screen-


Here click the Loadrunner full setup option to install the VUGen and keep following the instructions.
Click Next while you are prompted to install the pre-requisites for Loadrunner VUGen and agrre the terms and conditions thereafter.

After installation of prerequisites, you will be asked for selecting the type of installation. Just select "Custom" installation because we donot want to install the complete setup but VUGen.

Then you will get few options to select from. Just select "VUGenerator" and click Next. And keep clicking on Next button untill Finish.

 Note:- Please do not select Controller option otherwise you have no chance to format your system after 10 days, since the license is required only for LR controller and not VUGenearator.

After complete installation you will get the following screen-

Figure 2 - Startup screen


Here we are all set to start the recording of our script. Folks, if you are prompted to enter the license key after installation, just cancel without even bothering :)..Its not going to hamper your practice anymore..;) 

We will take the recording in later part... Till then you play with the installation of LR VUGen... Or if your machine is not equipped with the minimum requirements for installation, just start upgrading  that. :)

Till then chao...

Wednesday, April 14, 2010

Loadrunner- A performance Testing tool

Folks! I know I am not good in writing blogs and since it’s my very first day in this pursuit, you can expect some unexpected omissions/mistakes. :)

So let me begin with the introduction to web performance testing tool- Loadrunner.


Introduction:


Loadrunner was developed by Mercury and has been one of its extensively used kind of tool for the performance testing of various applications on different protocols (like- HTTP, SAP, Oracle, Seibel, SOAP, ICA to name a few) . I am not aware of much about the history of LR (Commonly used term for Loadrunner) but as per my tiny knowledge base, it came in the market with version 7.01 in August 2001. Later on many other versions came in the market but not with full fledged stable functionality. So Loadrunner was emerged with one of its stable version - v8.0. Currently the latest version which is being used in the IT era are version 9.0 and 9.5. Although version 9.0 has got few or for some several bugs. About version 9.5- this is now under functionality of user and so far there are positive outcomes to go with.


To give LR a shot one can start with an evaluation version of 10 days which can be downloaded from http://www.hp.com/ Ohh!!! I forgot to mention that Loadrunner is now with Hewlet Packard (HP). Mercury was acquired by HP on 25 July 2006 and on papers all the acquisitions were completed on 6 November 2006.


Components Of Loadrunner

There are four components of LR-

1) VUGen (also called as Virtual User Generator)

2) Load Generator (Also called as Load Injector)

3) Load Controller

4) Load Analyzer

First Component- VUGen

VUGen component is used primarily for recording the script. Then one can customize (modify) the script. I will be completely describing on how to record the script and how to customize in the later part.

Second Component- Load Generator

The significance/ function of Load generator(s) is/are first these are agents (clients) used to send the request to the web server and second, it communicates with the Load Controller (discussed in the next section).

Third Component- Load Controller

The third component is Load Controller which is used for the management of scripts/scenario/scheduling/monitoring/request/responses etc.

This is the platform on which a tester includes the scripts to be executed and configures the timing for how long the test will continue- Start time, end time, ramp-up, ramp-down of users etc...

Also, it allows tester to add the measurements for various performance counters for analyzing the resource usage of various servers (like Web server, App server, DB server, Report server etc)

Fourth Component- Load Analyzer

Load Analyzer is the tool used for analyzing the result of the performance/load test. This is very interesting area where an analyzer requires very good analytical mind. This tool provides you all kind of graphs like- transaction response time, running virtual users, error graphs, resource utilization graphs etc..

Moreover, you can create the template(s) for reusability, you can filter the un-necessary information from the result, you can save the session and generate the reports in various formats like- excel, word and HTML.

Introduction To Web Performance Testing

To start with, A web performance means different to different stakeholders (client, Business Analyst, Architect, Manager, Developer and testers). Overall, in the current scenario, a web's performance is analyzed by the response time (or page response time, or transaction response time).
The response time is the time taken by a HTTP page to appear to the end user (a person who actaully is browsing the web applciation).

This is obvious that for a layman the above definition is appropriate, but when we come to the broader one, we cannot set a gamut for it. For instance, an architect would be looking for the design pattern bottlenecks, the topology and network bottlenecks. A DBA would be interested to analyze the performance related to database parameters like- Long running queries or stored procedures, blockings (lockings), deadlocks, indices etc... A developer would be interested in finding out the bottlenecks in his own module/group of modules for the response time point of view (irrespective of the background processing in the environment)....A client would only like to know wheter his applciation is able to handle the specified number of user load and all the benchmarking parameters are as per the Service Level Agreement (SLA).
Whereas a tester has to look upon from bottom to top view of performance parameters... Unlike other stakeholders, he has to see all the covering parameters cater to the performance of application...

This was just an introduction on what actually a web performance means for a layman...and how its definition varies from person to person.